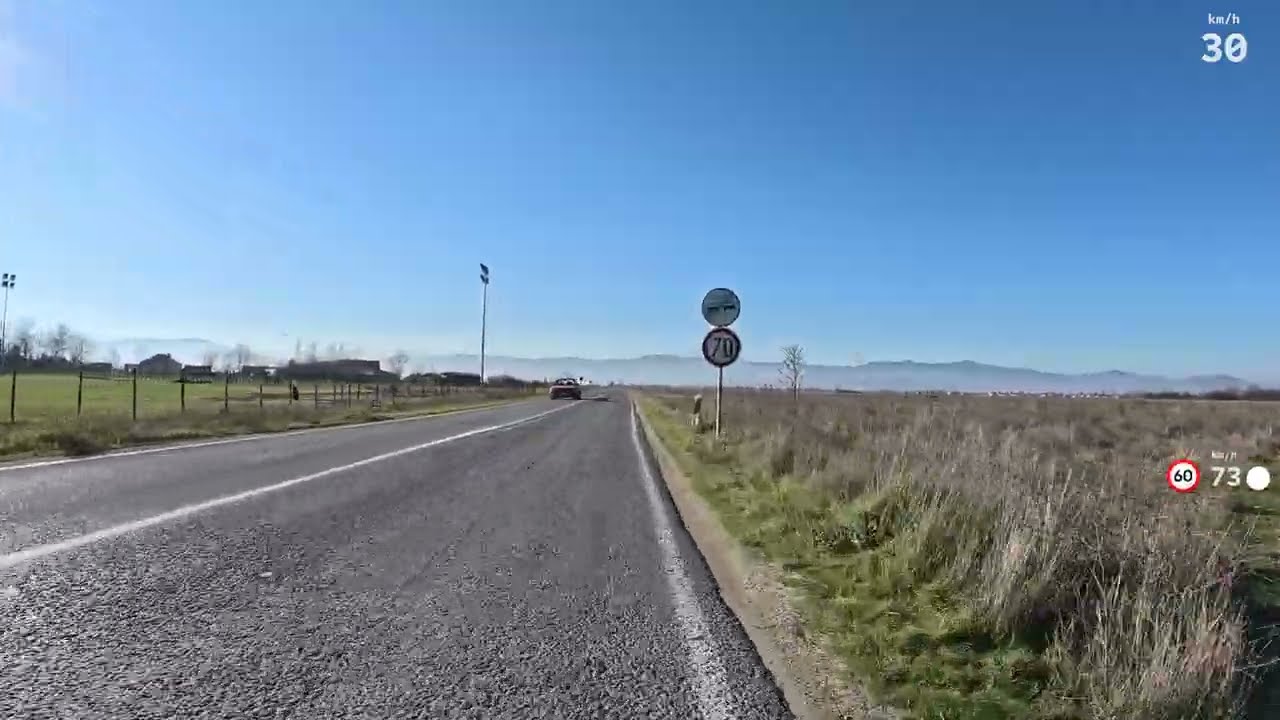
Telemetry overlay for approaching vehicles
Where I live, the car is king, and to make space for cars, we take it from pedestrians. Тhe regional roads, in the absence of bike paths, are meant to be shared, but most people don't feel safe sharing them with cars.
I wanted to have a better understanding of what's happening around me while cycling, so I started recording some of my rides, and was using a cycling radar that shows approaching vehicles. Then I thought it would be nice to assemble this in a more understandable format and share it with more people, and I'll have some fun while doing so.
In general, the plan was to mount a camera on the handlebars facing forward, a radar to see what's going on behind, and the activity is saved on my watch. Then I get home and put that data on top of the video.
I did a quick search to see if something like this exists, and I couldn't find anything, but anyway, I wanted to code it.
This is the equipment that I used:
- Garmin Varia radar tail light
- Garmin Forerunner 245 watch with MyBikeTraffic installed
- Camera
This is taken from Garmin's website about how the radar works:
Varia™ Radar Tail Lights have a radio transmitter that emits radar signals behind your bike and a receiver that detects radar signals reflected by moving objects behind you. It analyzes the reflected radar signal to identify vehicles and determine their distance and approach speed.
Read more about the radar here.
Parsing the activity file
Garmin uses the FIT format, and on a few previous occasions, I've been using adriangibbons/php-fit-file-analysis to parse the data, and it's been working great. But halfway through the project, I discovered that instead of returning an array of 8 elements for the radar data (one per vehicle), it just returned the value of the first element.
Radar data is not saved by default, which is why I had to use the MyBikeTraffic app, which saves it in the activity. I couldn't understand how there's only one value of the radar in my activity, while the app saves it as an array. It was in the communication with the creator of it that I realized that it's the parser's issue.
I ended up using dtcooper/python-fitparse, which produces a JSON file. Then I created a simple class that allowed me to traverse through it.
Here is a sample data point of my activity:
(
    [distance] => 8.9248  // km
    [enhanced_altitude] => 625.2  // m
    [enhanced_speed] => 30.7368  // km/h
    [heart_rate] => // bpm
    [passing_speed] => 154.8  // 154.8 / 3.6 = 43 km/h
    [passing_speedabs] => 74 // enhanced_speed + passing_speed = 30.7368 + 43 = 73.7368 km/h
    [position_lat] => 41.338638765737
    [position_long] => 21.471188860014
    [radar_current] => 18 // current car number
    [radar_ranges] => Array (  // distance from me in meters, for up to 8 cars
        [0] => 109
        [1] => 0
        [2] => 0
        [3] => 0
        [4] => 0
        [5] => 0
        [6] => 0
        [7] => 0
        )
    [radar_speeds] => Array ( // relative speed to me in m/s, for up to 8 cars
        [0] => 12
        [1] => 0
        [2] => 0
        [3] => 0
        [4] => 0
        [5] => 0
        [6] => 0
        [7] => 0
        )
    [timestamp] => 2025-12-14T11:55:47
)
Telemetry
I wanted to show only my speed and the speed of the approaching vehicles.
The approaching vehicles will also have a dot next to them signifying an object, a speed limit sign if it's faster than that, and all of them animated as they move towards me.
To create the vehicle dot and the speed limit sign, I used SVGViewer, which makes SVG files that were then converted to PNG. I need to overlay two things on the video - text and images, so I used ffmpeg's filters drawtext and overlay. On top of that, these were very long commands because we are dealing with something that changes every second and sometimes even more often than that. That's why I used a file where all of these filters are added, and then the file is passed as a parameter to ffmpeg using -filter_complex_script. It requires very careful assembling of the commands, the images first, and the text after that, so the text is shown above the images in the resulting video.
I had data for approximately every second, and simply adding the overlay on those timestamps caused the moving vehicles to just jump on the screen each second. What I thought first was to interpolate the distance between the two time points by adding 20 additional points between each second, which was working well, but it was producing much bigger scripts, which then increased the load on the processor. Then I found out that ffmpeg filters support animating the overlay, and I needed it only for the y-axis, which simplified things for me.
"drawtext=enable='between(t\\," . $timeNow . '\\,' . $timeNext . ")'",
"text='" . $passingSpeed . "'",
'fontfile=./resources/SUSEMono-ExtraBold.ttf',
'fontcolor=#[email protected]',
'fontsize=' . (40 * 2),
'box=1',
'[email protected]',
'boxborderw=5',
'x=' . (1815 * 2),
"y='if(between(t\\," . $timeNow . '\\,' . $timeNext . '),' . $vdSpeed . '-' . $vdSpeed - $nvdSpeed . '*(t-' . $timeNow . "))'",
At times, moving seems unnatural, but in my case, it looks good enough, and I didn't want to overcomplicate it with logarithmic motion or similar.
Then there were only a few cases to be solved, as the animated vehicle jumping forward in the case of multiple cars at the same moment, and mapping the speed limit signs to the appropriate timestamps in the absence of a better option, and it was ready.
Processing the video
I used ffmpeg, of course. The video was pretty heavy - 8GB, 4k@30fps, 17 minutes in total, so I ended up splitting it into chunks of 5 seconds because the process was taking too many resources and was getting killed by the system.
In short, I first split the video into 5-second chunks and, after overlaying the telemetry on each one of them, assembled it back. In both cases, I used the -c copy flag, so it's faster because it doesn't re-encode the video. However, because I didn't re-encode it, the chunks sometimes were not exactly 5 second long, which I have to account for later when overlaying the telemetry.
At the end, I got a decent speed of 10fps, which means I got my 17-minute video ready in approximately 50 minutes of processing.
The result
Click to play the video
Here's a link to the source code if you want to try it for yourself https://github.com/vasildb/radar-telemetry-overlay
Conclusion
The activity was done on a Sunday, a day with low traffic. I was surprised to see that there are always speed limit signs where needed; however, in just 17 minutes, we can see speeding over the limit, small lateral distance while overtaking, and risky overtaking in general.
In situations like this, recordings from self-made projects cannot be considered reliable evidence, especially now in times of AI. Perhaps this is wishful thinking, but if similar devices were government-issued and provided to volunteers under an official program, with proper incentives and standards, the collected data could be trusted and used to improve overall traffic safety.